 Dibz
GTA price cuts report: November 2026
19% of the 22,736 homes for sale in Toronto and the GTA on November 8, 2026 were priced below their original asking price, by a median 4.8%. By city, type of home, price and time on the market. Monthly, with a free CSV.
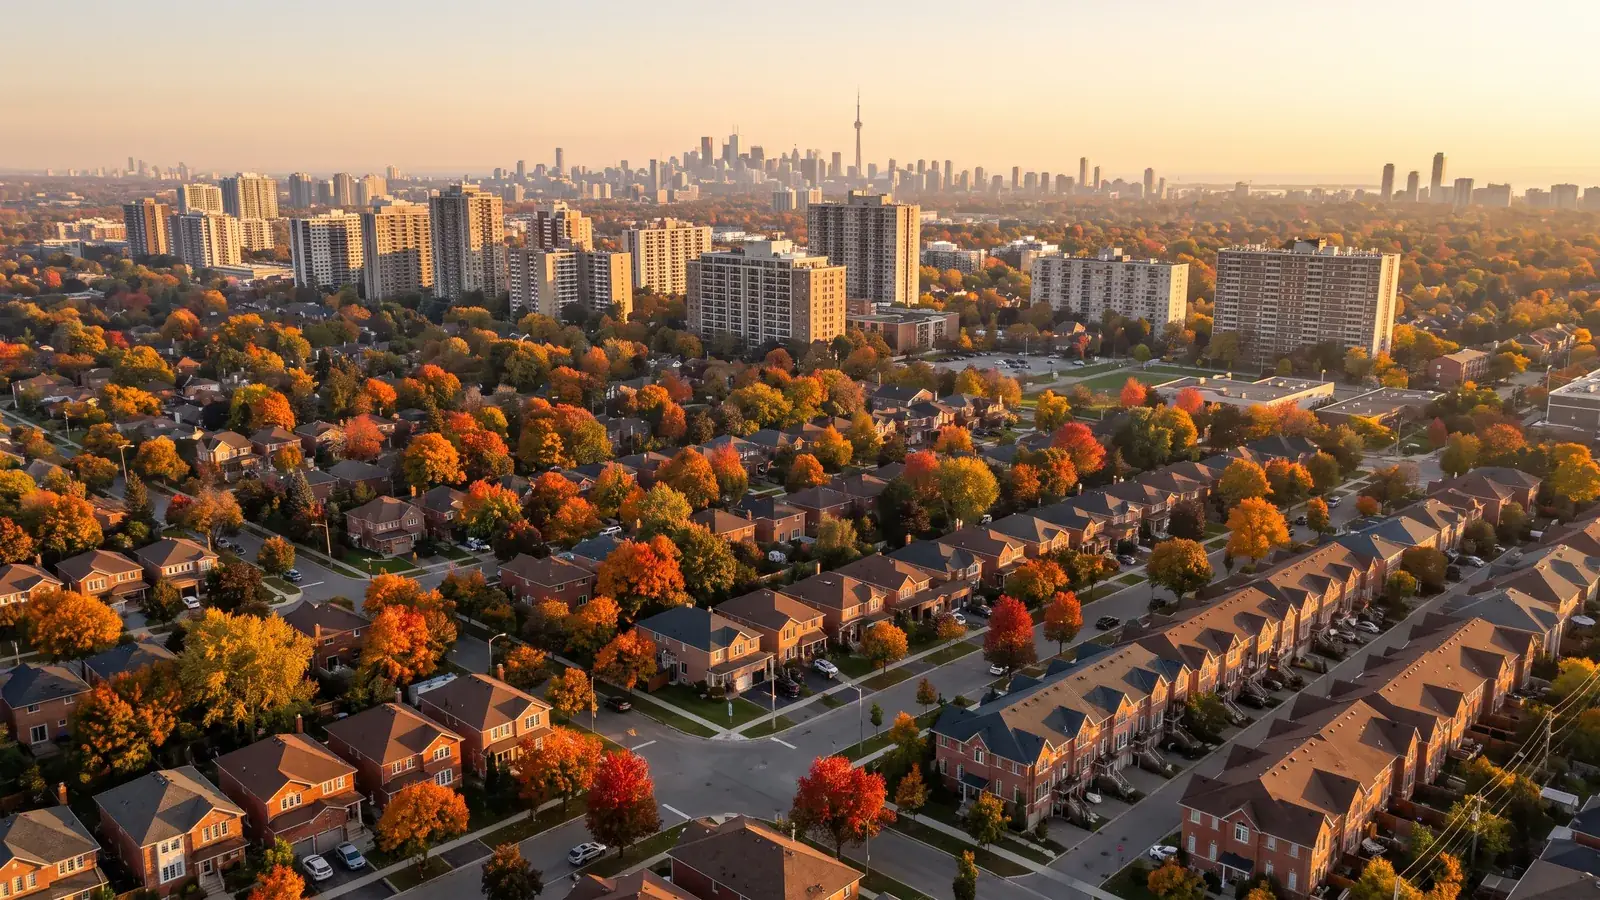
On November 8, 2026, 22,736 homes were for sale across Toronto, York, Peel, Durham and Halton, and 4,227 of them (19%) were asking less than when they were first listed. The median cut was 4.8%, or $46,100. In the last 30 days alone, 2,633 homes lowered their price.
This is the Dibz GTA price cuts report: a monthly snapshot of how many sellers have lowered their asking price, by how much, and where, from the MLS® listings shown on Dibz. It compares each listing's current asking price with its own original asking price, uses medians, publishes only groups of at least 20 listings, and never uses sale prices. Reporters, researchers and buyers are welcome to quote it with a link back, and the whole table is a free CSV download.
Asking prices of active listings, not sale prices.
Source: Dibz analysis of active MLS® listings (TRREB, via PropTx), Nov 8, 2026
What stands out
- Price cuts come with time on the market. 1% of homes listed in the last two weeks have cut their price, against 42% of homes listed more than six months ago, where the median cut is 8.5% ($96,900).
- 2,633 homes cut their price in the last 30 days, 12% of everything for sale in the GTA.
- Every type of home is cutting at about the same rate: 18% to 20% of detached houses, semis, townhouses and condo apartments have a price cut. In dollars the biggest median cut is on detached houses, $70,000, against $30,000 on condo apartments.
- Cheaper homes cut more often, pricier homes cut deeper. 21% of homes under $700K have a price cut, against 11% of homes at $3M and up, but the median cut at the top is 5.9% ($299,000).
- Among cities with at least 300 homes for sale, Burlington (24%), Milton (22%) and Oakville (21%) have the highest share of price cuts, and Brampton (15%), Pickering (16%) and Richmond Hill (16%) the lowest.
- In the City of Toronto, 18% of 9,157 homes for sale have cut their price, by a median 4.9%: 19% in North York, 19% in Scarborough, 19% in Etobicoke and 18% in the rest of the city (the former Toronto, East York and York).
This is the first edition. The next one will compare each group with this snapshot.
Price cuts by type of home
| Type of home | Homes for sale | With a price cut | Share | Median cut | Median cut ($) | Median asking price |
|---|---|---|---|---|---|---|
| All five types | 22,736 | 4,227 | 19% | 4.8% | $46,100 | $899,990 |
| Detached house | 10,408 | 1,838 | 18% | 5.0% | $70,000 | $1,399,000 |
| Semi-detached house | 1,253 | 229 | 18% | 4.6% | $45,000 | $925,000 |
| Freehold townhouse | 1,519 | 289 | 19% | 4.6% | $40,000 | $899,000 |
| Condo townhouse | 1,820 | 348 | 19% | 4.1% | $30,000 | $687,500 |
| Condo apartment | 7,736 | 1,523 | 20% | 4.9% | $30,000 | $559,900 |
Median cut: among the homes with a price cut, the median percentage and dollar amount below their original asking price.
Price cuts by time on the market
The longer a home sits, the more likely its seller has cut the price, and the bigger the cut. A home listed in the last two weeks almost never has; a home that has been for sale for months often has, sometimes more than once.
Price cuts by asking price
| Asking price | Homes for sale | With a price cut | Share | Median cut | Median cut ($) | Median asking price |
|---|---|---|---|---|---|---|
| Under $700K | 7,739 | 1,628 | 21% | 4.9% | $29,000 | $539,999 |
| $700K to $1M | 5,427 | 1,059 | 20% | 4.5% | $40,000 | $859,900 |
| $1M to $1.5M | 4,545 | 780 | 17% | 4.5% | $54,000 | $1,239,800 |
| $1.5M to $2M | 2,139 | 385 | 18% | 5.3% | $100,000 | $1,728,000 |
| $2M to $3M | 1,497 | 223 | 15% | 5.8% | $150,000 | $2,499,000 |
| $3M and up | 1,389 | 152 | 11% | 5.9% | $299,000 | $4,350,000 |
Price cuts by city
| Area | Homes for sale | With a price cut | Share | Median cut | Median cut ($) | Median asking price |
|---|---|---|---|---|---|---|
| GTA (all five regions) | 22,736 | 4,227 | 19% | 4.8% | $46,100 | $899,990 |
| Toronto | 9,157 | 1,677 | 18% | 4.9% | $40,000 | $795,000 |
| ↳ North York (Toronto) | 1,999 | 374 | 19% | 5.0% | $47,000 | $819,000 |
| ↳ Scarborough (Toronto) | 1,340 | 258 | 19% | 4.9% | $35,950 | $749,000 |
| ↳ Etobicoke (Toronto) | 1,229 | 230 | 19% | 4.6% | $40,000 | $799,000 |
| Mississauga | 2,205 | 453 | 21% | 4.7% | $48,000 | $875,000 |
| Brampton | 1,501 | 232 | 15% | 4.4% | $40,100 | $870,000 |
| Vaughan | 1,193 | 227 | 19% | 4.8% | $50,000 | $1,098,800 |
| Markham | 1,010 | 175 | 17% | 4.4% | $48,889 | $1,098,000 |
| Oakville | 965 | 205 | 21% | 4.7% | $61,000 | $1,450,000 |
| Richmond Hill | 921 | 149 | 16% | 5.6% | $54,900 | $1,233,000 |
| Burlington | 649 | 156 | 24% | 4.6% | $49,050 | $948,000 |
| Oshawa | 609 | 128 | 21% | 4.8% | $35,800 | $709,000 |
| Milton | 467 | 102 | 22% | 4.6% | $42,500 | $999,111 |
| Clarington | 405 | 69 | 17% | 4.0% | $30,900 | $785,900 |
| Pickering | 402 | 64 | 16% | 4.5% | $40,000 | $889,000 |
| Whitby | 402 | 68 | 17% | 5.0% | $49,100 | $949,850 |
| Caledon | 388 | 67 | 17% | 4.4% | $54,999 | $1,299,900 |
| Georgina | 352 | 65 | 18% | 5.1% | $40,000 | $888,944 |
| Newmarket | 291 | 53 | 18% | 4.8% | $50,000 | $990,000 |
| Aurora | 285 | 51 | 18% | 6.3% | $51,000 | $1,199,000 |
| Whitchurch-Stouffville | 277 | 64 | 23% | 4.9% | $70,000 | $1,200,000 |
| Ajax | 276 | 45 | 16% | 5.0% | $44,100 | $874,950 |
| Halton Hills | 227 | 47 | 21% | 4.2% | $43,888 | $1,174,900 |
| King | 221 | 33 | 15% | 6.4% | $109,000 | $2,295,000 |
| East Gwillimbury | 207 | 32 | 15% | 5.2% | $63,150 | $1,269,990 |
| Scugog | 123 | 22 | 18% | 6.3% | $55,000 | $999,000 |
| Brock | 98 | 22 | 22% | 8.4% | $55,400 | $838,750 |
| Uxbridge | 97 | 20 | 21% | 4.2% | $46,450 | $1,196,000 |
Inside the City of Toronto
| Type of home | Homes for sale | With a price cut | Share | Median cut | Median cut ($) | Median asking price |
|---|---|---|---|---|---|---|
| All five types | 9,157 | 1,677 | 18% | 4.9% | $40,000 | $795,000 |
| Detached house | 2,652 | 431 | 16% | 5.0% | $90,000 | $1,579,000 |
| Semi-detached house | 534 | 95 | 18% | 5.5% | $60,012 | $1,092,500 |
| Freehold townhouse | 241 | 43 | 18% | 4.4% | $44,000 | $1,095,000 |
| Condo townhouse | 663 | 124 | 19% | 4.1% | $30,000 | $699,000 |
| Condo apartment | 5,067 | 984 | 19% | 4.9% | $30,000 | $578,000 |
What it means if you're buying
- Check how long a home has been for sale. Every home on Dibz shows its days on the market. A home past 60 days is far more likely to have room on price than one listed last week.
- A price cut isn't a bargain by itself. Some homes were listed high to begin with. Compare the new price with what similar homes nearby sold for. Sold prices are free with a Dibz account, and a buyer's agent can pull the comparables for you.
- Get alerts for price drops. Save a search or follow a home on Dibz and you'll hear the moment its price changes.
- Budget for closing costs. Land transfer tax is due on closing, and in Toronto you pay it twice. Our land transfer tax calculator works it out for any price.
Start with the homes for sale in Toronto, Mississauga, Brampton, Vaughan, Markham, Oakville, Richmond Hill, Burlington, Oshawa, Milton, Clarington and Pickering, the new listings this week or the open houses this weekend. If you'd like help negotiating, talk to a Dibz buyer's agent.
How we worked it out
- Homes: active MLS® listings for sale on November 8, 2026 in the City of Toronto and the York, Peel, Durham and Halton regions, shown on the internet, without an accepted offer, asking $50,000 to $30,000,000, of five types: detached, semi-detached, freehold townhouse, condo townhouse and condo apartment.
- A price cut: the current asking price is lower than the original asking price of the same MLS® listing. A home taken off the market and listed again under a new MLS® number starts over, so the real number of reduced homes is higher than this report shows. Listings whose original price is under half or over twice the current one are left out as data entry errors.
- In the last 30 days: the home's latest price change was a cut, made in the 30 days before the snapshot.
- Rules: medians, not averages; a group is shown only with at least 20 listings, and its median cut only with at least 20 reduced listings. No sold or leased prices are used.
FAQ
How many GTA homes have cut their price?
4,227 of the 22,736 homes for sale in Toronto and the GTA on November 8, 2026, or 19%, were asking less than their original price. 2,633 of them cut it in the last 30 days.
How big is a typical price cut?
The median cut was 4.8% of the original asking price, or $46,100. On detached houses it was 5.0% ($70,000), and on condo apartments 4.9% ($30,000).
Which homes are most likely to have a price cut?
Homes that have been on the market longest. 42% of homes listed more than six months ago have cut their price, against 1% of homes listed in the last two weeks.
Is it a buyer's market in Toronto?
This report doesn't measure that on its own: it counts asking-price cuts, not sales. A high share of price cuts does mean many sellers are adjusting to buyers, which gives you more room to negotiate.
How often is the report updated, and can I use the data?
Every month, from a new snapshot of active listings using the same method. You're welcome to quote or chart the numbers with credit to Dibz and a link to this page. The CSV download has every published figure.
Sources
- Dibz analysis of active MLS® listings (TRREB, via PropTx), Nov 8, 2026: current and original asking prices of active for-sale listings in the City of Toronto and York, Peel, Durham and Halton regions, medians of groups with at least 20 listings.
- Toronto Regional Real Estate Board (TRREB): the MLS® System the listings come from.
Asking prices are not sale prices. MLS® listing data by PropTx under licence from TRREB, deemed reliable but not guaranteed accurate. This report is general information, not real estate, legal or financial advice.
Dibz is a home search app for the Greater Toronto Area, built on the live TRREB MLS® feed and operated by HighPoint Homes Realty, Brokerage. We write these guides from what we see in the market every day and check every rule and number against official sources, listed at the end of each article. Charts marked "Dibz analysis" are calculated from active MLS® listings on the date shown. How we research, date and correct articles: our editorial policy.
Keep reading
Average home prices in the GTA by city (October 2026)
What homes for sale ask in 22 GTA cities in October 2026, from Toronto and Mississauga to Oshawa and King, by home type, with price per square foot.
How to read GTA sold prices and make a smart offer (2026)
How to read GTA sold prices to price an offer in 2026: pick comparables, read days on market and price cuts, spot relisted homes and check value estimates.
Can you back out of an accepted offer in Ontario? (2026)
An accepted offer on a resale home in Ontario is binding, with no cooling-off period. See the ways out that do exist, and the 10-day rule for new condos.